
BUSINESS
The 10-Year’s Run to 5% Rests on Thin Hands
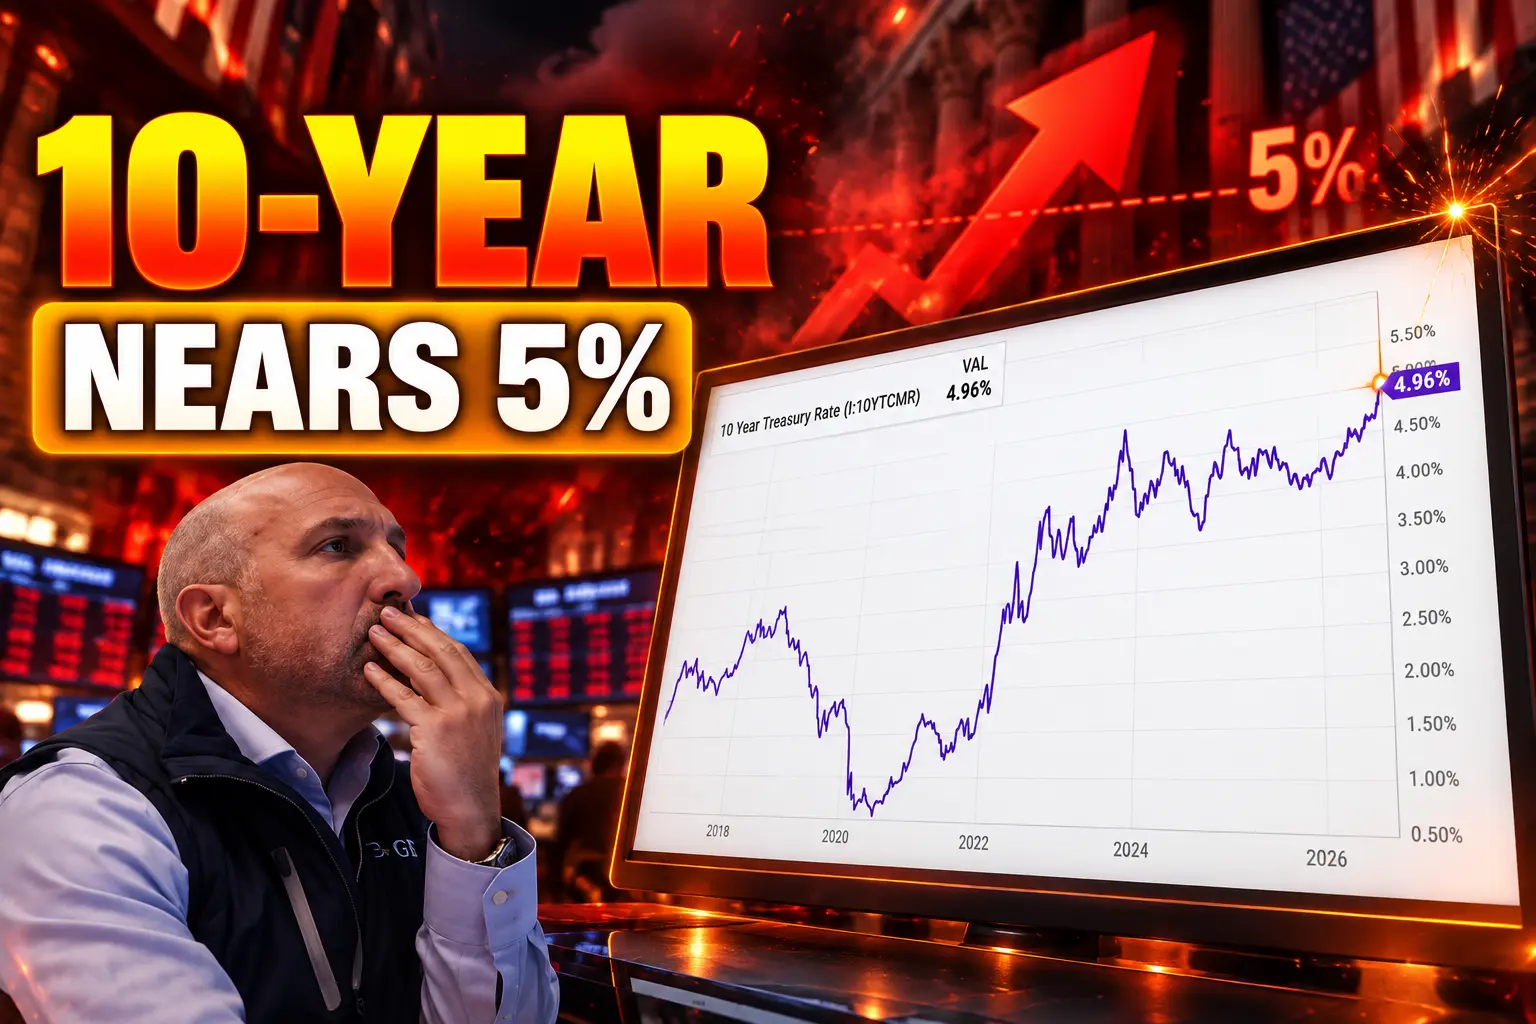
The 10-year Treasury yield closed at 4.96%, leaving leveraged funds and a short buyback desk to decide if a 5% print stays orderly.

The 10-year Treasury yield closed at 4.96% on September 11, 2026, a few ticks from the 5% line it last tagged in October 2023. The print followed an 18 basis-point rise from 4.78% on September 4, on the daily Treasury par yield curve, and it left the note at its highest close since that 2023 breach.
Equity desks are arguing about whether 5% kills the rally. The people who have to warehouse the growing pile of notes are a thin group of leveraged funds and a Treasury buyback desk that, on September 10, took less paper than it had room to buy.
The 10-Year Closed Friday a Few Ticks From 5%
Friday’s 4.96% close sat 95 basis points above the 4.01% yield a year earlier. The 30-year yield was 5.35% as of September 13. The Federal Reserve’s target range has been 3.50% to 3.75% through five straight holds, so the long end is moving on its own, not on a matching jump in the overnight rate.
THE TAPE INTO THE 5% LINE
- Friday close: The 10-year finished September 11 at 4.96%, up 18 basis points from 4.78% on September 4.
- The long bond: The 30-year yield was 5.35% as of September 13, a 19-year neighborhood first flagged when the 30-year pushed to highs last seen in 2007.
- Policy rate: The funds target remains 3.50% to 3.75% after holds in January, March, April, June, and July.
- Year-ago 10-year: 4.01%, which means this selloff has added almost a full point of yield in 12 months.
Jason Ware, chief investment officer at Albion Financial Group, said he does not expect markets to break simply because the 10-year moves above 5%, and he pointed to a resilient economy and steady core inflation. Niall O’Sullivan, chief investment officer at Marsh Investments, said many of the companies driving the equity rally are not especially sensitive to higher rates, and that heavy capital spending is still supporting growth. BMO Capital Markets strategists noted that when the 10-year reached 4.85%, weakness in equities stayed modest and the S&P 500 was still up more than 11% for the year.
That stock-market case can be true and still miss the bid that has to clear each auction. Ware himself tied part of the latest rise to a supply-demand imbalance, as heavy Treasury and corporate issuance competes for the same cash. The 10-year is the reference for mortgages, corporate debt, and the discount rate on stocks. If the next tick through 5% is a shortage of holders rather than a burst of growth, the first crack will not show up in the Nasdaq.
Who Still Has to Hold the Growing Pile
Large hedge funds have become a bigger warehouse for Treasuries than mutual funds or U.S. banks. A June 22, 2026, FEDS Note by Federal Reserve Board principal economist Phillip Monin, using SEC Form PF filings through September 2025, found that large funds’ gross Treasury exposures had doubled since 2023 to $4.0 trillion, made up of $2.4 trillion long and $1.6 trillion short. Their share of privately held Treasuries rose from about 4.5% at the start of 2023 to about 8.5%. Repo cash borrowing to finance those books reached $3.0 trillion. The 50 largest funds by gross Treasury exposure accounted for about 90% of the activity, up from 84% at the start of 2023.
The Basis Trade Doubled Its Old Peak
Monin’s decomposition puts an $830 billion cash-futures basis trade at the center of that book, about double its early-2020 peak and 35% of the long exposure. In that trade, funds buy cash Treasuries, sell Treasury futures, and finance the bond in repo, often at low or zero haircuts. The same note put basis-trade holdings at 3.5% of privately held Treasuries by market value, up from a 2.5% peak in early 2020. George Awad, principal at Gibraltar Capital, has flagged that leveraged hedge-fund book, including the cash-futures basis trade, as a channel that can amplify a selloff if funding costs, margins, or volatility jump and positions have to come off together.
HEDGE FUND TREASURY USES, SEPTEMBER 2025
| Use of long exposure | Estimated size | Share of $2.4T long book |
|---|---|---|
| Cash-futures basis trade | $830 billion | 35% |
| Maturity-matched trades | $395 billion | 17% |
| Steepener-like trades | $375 billion | 16% |
| Swap-spread arbitrage | $305 billion | 13% |
| Unencumbered cash | $245 billion | 10% |
| Flattener-like trades | $175 billion | 7% |
| Long-only investment uses | $70 billion | 3% |
Those figures are Fed staff approximations from Form PF, not live September 2026 positions, and they already showed how concentrated the bid had become a year ago. Highly leveraged arbitrage (the basis trade plus swap-spread books) accounted for nearly half the long exposure. Only $70 billion, 3% of the long book, looked like outright long-only investment.
April’s Swap Unwind Was a Warning
The swap-spread book, a repo-financed long Treasury paired with a pay-fixed swap, reached about $305 billion, 13% of long exposure, by September 2025. After the April 2025 tariff announcements, about $60 billion of that book, 20% of the position, unwound in April and a further $40 billion came off in May, before the trade rebuilt. That episode is the closest recent map of what Awad is describing: when volatility hits, the same funds that absorbed supply can become the supply.
By June 2026, dealers were already telling clients the cash-futures basis itself was losing its allure as spreads tightened and funding costs rose. If that warehouse is full, or if it starts to shrink, the next $10 billion of coupons has to find a slower buyer. That is the hidden stake under a 4.96% 10-year. It is not a stock-market round number. It is a question of who still wants the bonds once the levered bid steps back.
Bessent’s First Expanded Buyback Came Up Short
Treasury Secretary Scott Bessent has tried to put an official bid under the long end. On August 19, the department said it would at least double liquidity-support buybacks of 10- to 20-year and 20- to 30-year nominal coupons, lifting the per-operation ceiling from $2 billion to at least $4 billion, with the larger ops running from September 9 through November 4. On September 9 it set the first of those operations at a $6 billion maximum, triple the old $2 billion cap in that bucket. Bessent has said he cannot alter the equilibrium price of Treasuries and that his aim is to slow the move and keep a damaging narrative from taking hold.
I have asymmetric information. I am the house now.
Scott Bessent, Treasury secretary, speaking in Washington
The house did not take the whole offering. On September 10, in the first test of the expanded program, the department bought $5.19 billion of 10- to 20-year securities against that $6 billion cap, with $10.5 billion of offers in the book. It was only the third time officials had declined to fill the maximum in longer-dated buybacks across 53 operations since the program was brought back in 2024. The 10-year yield extended higher after the result, up 11 basis points to 4.95% on the session. Molly Brooks, a strategist at TD Securities, said the outcome signaled that Treasury was more selective than it usually is in that part of the curve, and that filling future ops to hold long-end rates down may require accepting less competitive bids.
THE BUYBACK CALENDAR THAT DID NOT PIN YIELDS
- 2024: Treasury restarts regular Treasury securities buyback operations in off-the-run nominal coupons and TIPS, with 53 operations logged through September 10, 2026.
- August 19, 2026: The department says it will at least double long-end liquidity-support ops from a $2 billion ceiling to at least $4 billion through November 4.
- September 9, 2026: The first expanded 10- to 20-year operation is sized at a $6 billion maximum, and the 10-year yield still pushes toward 4.85%.
- September 10, 2026: Officials accept $5.19 billion against the $6 billion cap, with $10.5 billion offered, and the 10-year extends to 4.95%.
BMO Capital Markets strategists said a more active buyback program could help limit selling pressure but “fails to address the prevailing fundamental drivers of the upward pressure on 10- and 30-year yields.” The arithmetic is blunt. A $6 billion operation, even if filled, is a rounding error next to a market in which hedge funds alone carried $2.4 trillion of long exposure a year ago and in which the Treasury still has to issue through a deficit that has already taken total public debt outstanding to $40.047 trillion as of August 18, with $32.266 trillion of that held by the public and $7.782 trillion in intragovernmental accounts. The first expanded op told holders the official bid is real, and that it will not chase every offer.
Homebuyers Are Already Paying the Spread
The 10-year is the reference most lenders use to set the 30-year mortgage. Freddie Mac’s Primary Mortgage Market Survey put the average 30-year fixed at 6.76% as of September 10, up from 6.71% the prior week and from 6.35% a year earlier. The 15-year averaged 6.09%, up from 6.04% and from 5.50% a year earlier. That is not the 8% 30-year that printed when the 10-year first tagged 5% in October 2023, but it is a 41 basis-point rise in 12 months, and it arrived in the same week the 10-year closed at 4.96%.
WHERE A 4.96% 10-YEAR SHOWS UP
- Purchase mortgages: Freddie Mac said the 30-year fixed averaged 6.76 percent as of September 10, a five-basis-point rise on the week.
- Corporate borrowers: Heavy coupon supply from companies, much of it tied to AI buildouts, is competing with Treasury for the same duration bid Ware described.
- The federal book: Debt held by the public was $32.266 trillion on August 18, so each extra point of long-term yield feeds directly into future interest costs on new issuance and rolling notes.
Oil added another push under that mortgage rate. On September 10, Brent crude settled at $107.90 a barrel, up 6.6%, after crossing $100 for the first time since July 23, and West Texas Intermediate was at $102.70, up 6.9%, after recrossing $100 for the first time since May. The Bureau of Labor Statistics said the August producer price index rose 0.4% on the month and 5.4% from a year earlier, with goods prices up 1.1%. A 10-year that is rising because energy is feeding inflation is a different animal from a 10-year that is rising because the economy is strong. Mortgage applicants do not get to pick which one they pay.
The Last Time Yields Kissed 5%, Buyers Showed Up
On October 23, 2023, the 10-year yield traded as high as 5.02%, the first print above 5% since July 2007, then reversed and settled at 4.84%. The breach was fast. Yields had climbed from below 4% in August of that year, and the 5% print pulled in buyers who had been waiting for a round number. The 30-year mortgage was around 8% that week. Stocks whipped around the same session, with the S&P 500 down as much as 0.8% and then up as much as 0.8%.
That 2023 fade is the hope trade now: hit 5%, watch the dip buyers arrive, and go home. The setup is not the same. In 2023 the move was a 16-year novelty after a 170-basis-point surge in six months, and the official sector was not running a buyback program sized as a yield tool. This time the 10-year has spent months grinding from the mid-4s, the 30-year is already above 5%, total public debt has cleared $40.047 trillion, and the Treasury’s own desk just passed on $810 million of bonds it had room to buy. Dip buyers may still show up at 5.00%. They will be standing next to a buyback account that has already shown it will not fill every bid, and next to hedge-fund books that can shrink by tens of billions in a month, as they did in April and May 2025.
O’Sullivan’s point still holds for the equity tape: the firms spending on AI are not a pure duration trade. Ware’s point holds too, until consumer spending or that AI spend actually rolls over. The 2023 lesson is narrower. A 5% print can reverse in a single session when the sellers are exhausted. It can also keep going when the exhausted party is the buyer of last resort.
Oil and a Fed Meeting Now Sit on the Same Trade
The Federal Open Market Committee meets September 15-16, with a rate decision and a new Summary of Economic Projections due at 2 p.m. Eastern on September 16. As of September 10, CME FedWatch put the odds of a 25-basis-point hike to 3.75% to 4.00% at 71.5%, after Chair Kevin Warsh’s hawkish Jackson Hole remarks on August 28. A hike would not, by itself, set the 10-year. It would tell the same leveraged holders that funding costs are moving the wrong way for a repo-financed long bond book while oil sits above $100 and the buyback desk is picking spots.
WHAT WE KNOW
- The close: The 10-year finished September 11 at 4.96%, 18 basis points above September 4 and 95 basis points above its level a year earlier.
- The official bid: The first expanded long-end buyback on September 10 took $5.19 billion of a $6 billion cap.
- The private warehouse: As of September 2025, the Fed staff’s basis-trade estimate was $830 billion, inside a $2.4 trillion long hedge-fund book.
WHAT IS UNCONFIRMED
- A 5% print: The 10-year has not closed at or above 5% in this move; Friday’s 4.96% is still a near miss.
- The September 16 decision: A hike is the majority market bet, not a vote that has been taken.
- The next buyback: Officials have not said whether they will fill the next long-end cap after taking less than the maximum on September 10.
A disorderly path to 5% would start in repo and in futures margin, not in the S&P 500. That is the Awad risk, and it is the same plumbing the Fed note mapped when $100 billion of swap-spread trades came off in two months last spring. An orderly path looks like October 23, 2023: a round-number print, a rush of cash, and a close back below 5%. The difference is who is sitting on the bid. Last time it was discretionary buyers who had waited for 5%. This time one of those buyers is the Treasury, and on September 10 it left $810 million on the table.
The committee’s decision on September 16 lands two days after the 10-year closed at 4.96%. The last time that yield printed 5.02%, it did not stay there through the close.
Disclaimer: This article is news reporting and analysis of Treasury yields, mortgage rates, and related market data, and it is for information only. It is not investment, tax, legal, or trading advice, and it is not a recommendation to buy, sell, or hold any bond, fund, stock, or derivative. Readers should consult a licensed financial adviser, tax professional, or investment manager who can review their own objectives and constraints before acting on any figure or scenario here. Yields, mortgage averages, auction results, and policy odds are those published by the sources named above as of the dates given and can change in the next session.

Hurricane Nolo Hits a Big Island Still Digging Out

Gaza Families Remain in Buildings Already Cleared to Fall

Sony Polls Publishers Who Cannot Press PlayStation Discs Elsewhere

UN Settlement List Hits 214 as Investors Take Notice

Fuel Pushes UK Inflation to 3.1% With Core Unchanged

Thameslink Will Pad 60,000 Ironing-Board Seats From 2027

Micron Sells the Memory Shortage as Five-Year Contracts

Royal Caribbean Sends Los Angeles Ships to Singapore and Brisbane

Burger King Rebuilds Chicken Nuggets After Calling Them Rubbery

U.S. Forces Clear Hormuz Mines, Then Hit Minelayers Again
-
 NEWS1 month ago
Thameslink Will Pad 60,000 Ironing-Board Seats From 2027
-
 NEWS1 month ago
Micron Sells the Memory Shortage as Five-Year Contracts
-
 NEWS1 month ago
Royal Caribbean Sends Los Angeles Ships to Singapore and Brisbane
-
 BUSINESS1 month ago
Burger King Rebuilds Chicken Nuggets After Calling Them Rubbery
-
 BUSINESS1 month ago
U.S. Forces Clear Hormuz Mines, Then Hit Minelayers Again
-

 NEWS1 month ago
Twenty Controllers Closed Norwich Airport for a Bank Holiday
-

 BUSINESS1 month ago
Sweetmore Bakeries Buys Fantasy Baking for Bar Work
-

 NEWS1 month ago
Frontier Miles Cuts Basic Fares After the Barclays Pact